Lab 1 — Chat with your data
Participants connect to the Impala TPC-DS database connector in Vibe to query live retail datasets using natural language and custom semantic skills. This matters because it demonstrates how to bridge raw database schemas with business context, enabling accurate exploration and polished visual analytics.
Let's start in Vibe - Chat. https://chat.mistral.cloudera-applied-ai.com/chat
Let's see what data we have access to. Use the following prompt to get a sense of the TPCDS data. Investigate a bit more using the connector to understand what data exists in the dataset.
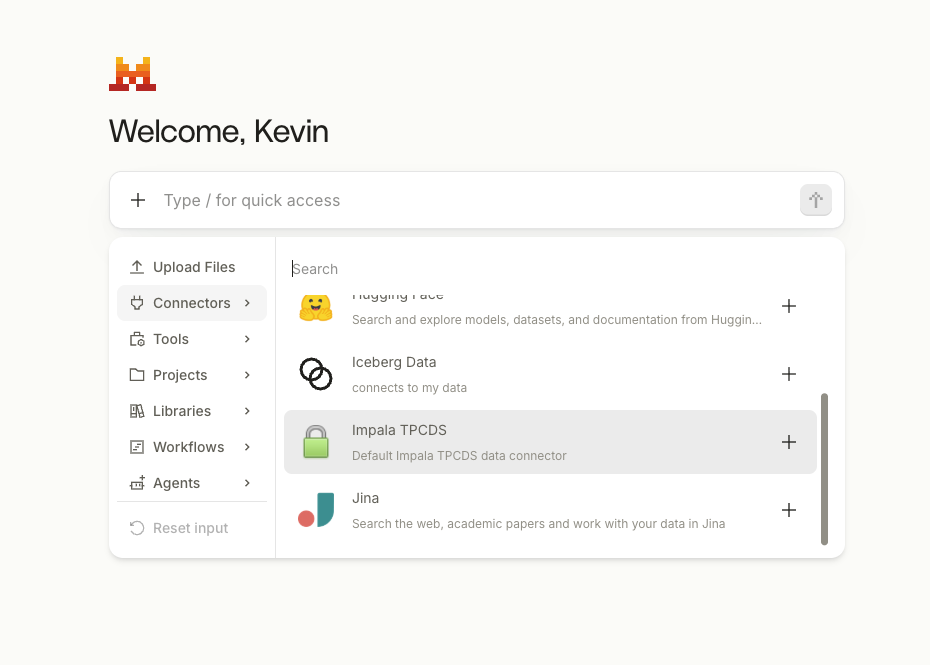
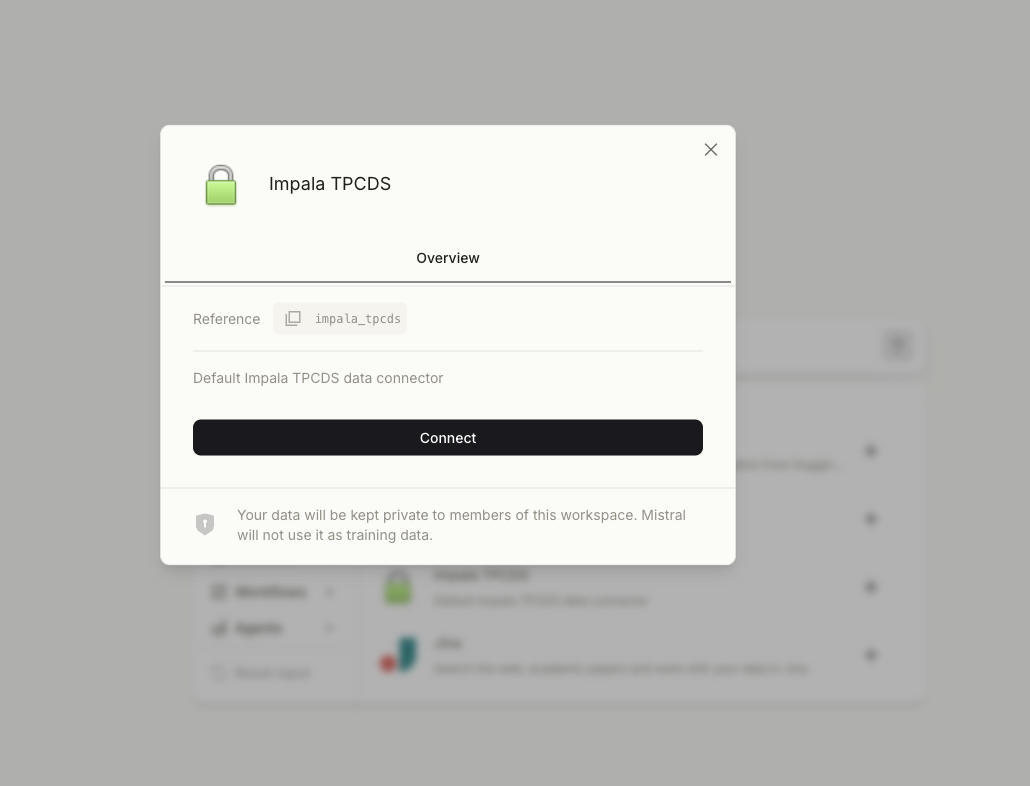
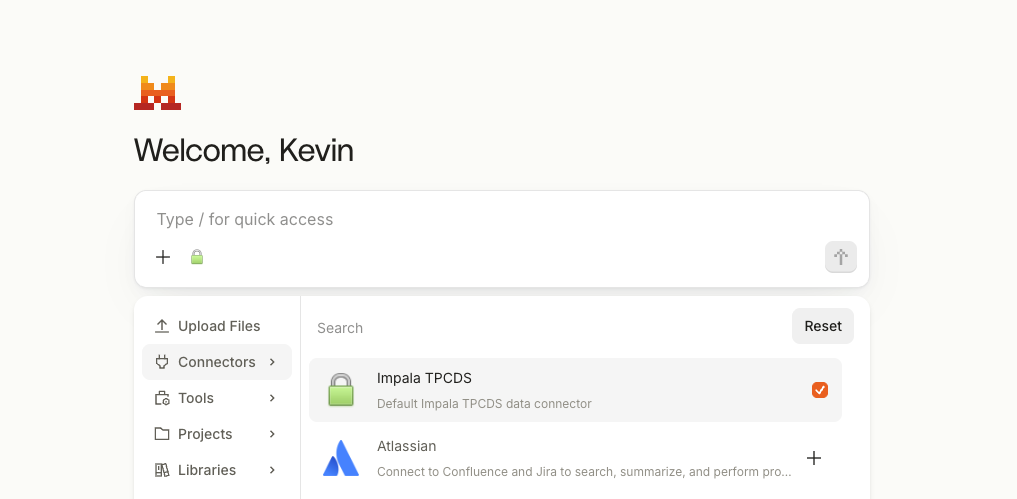
Select the Impala TPCDS Connector from the available Connectors:
Ask in chat:
What are the tables in my database?
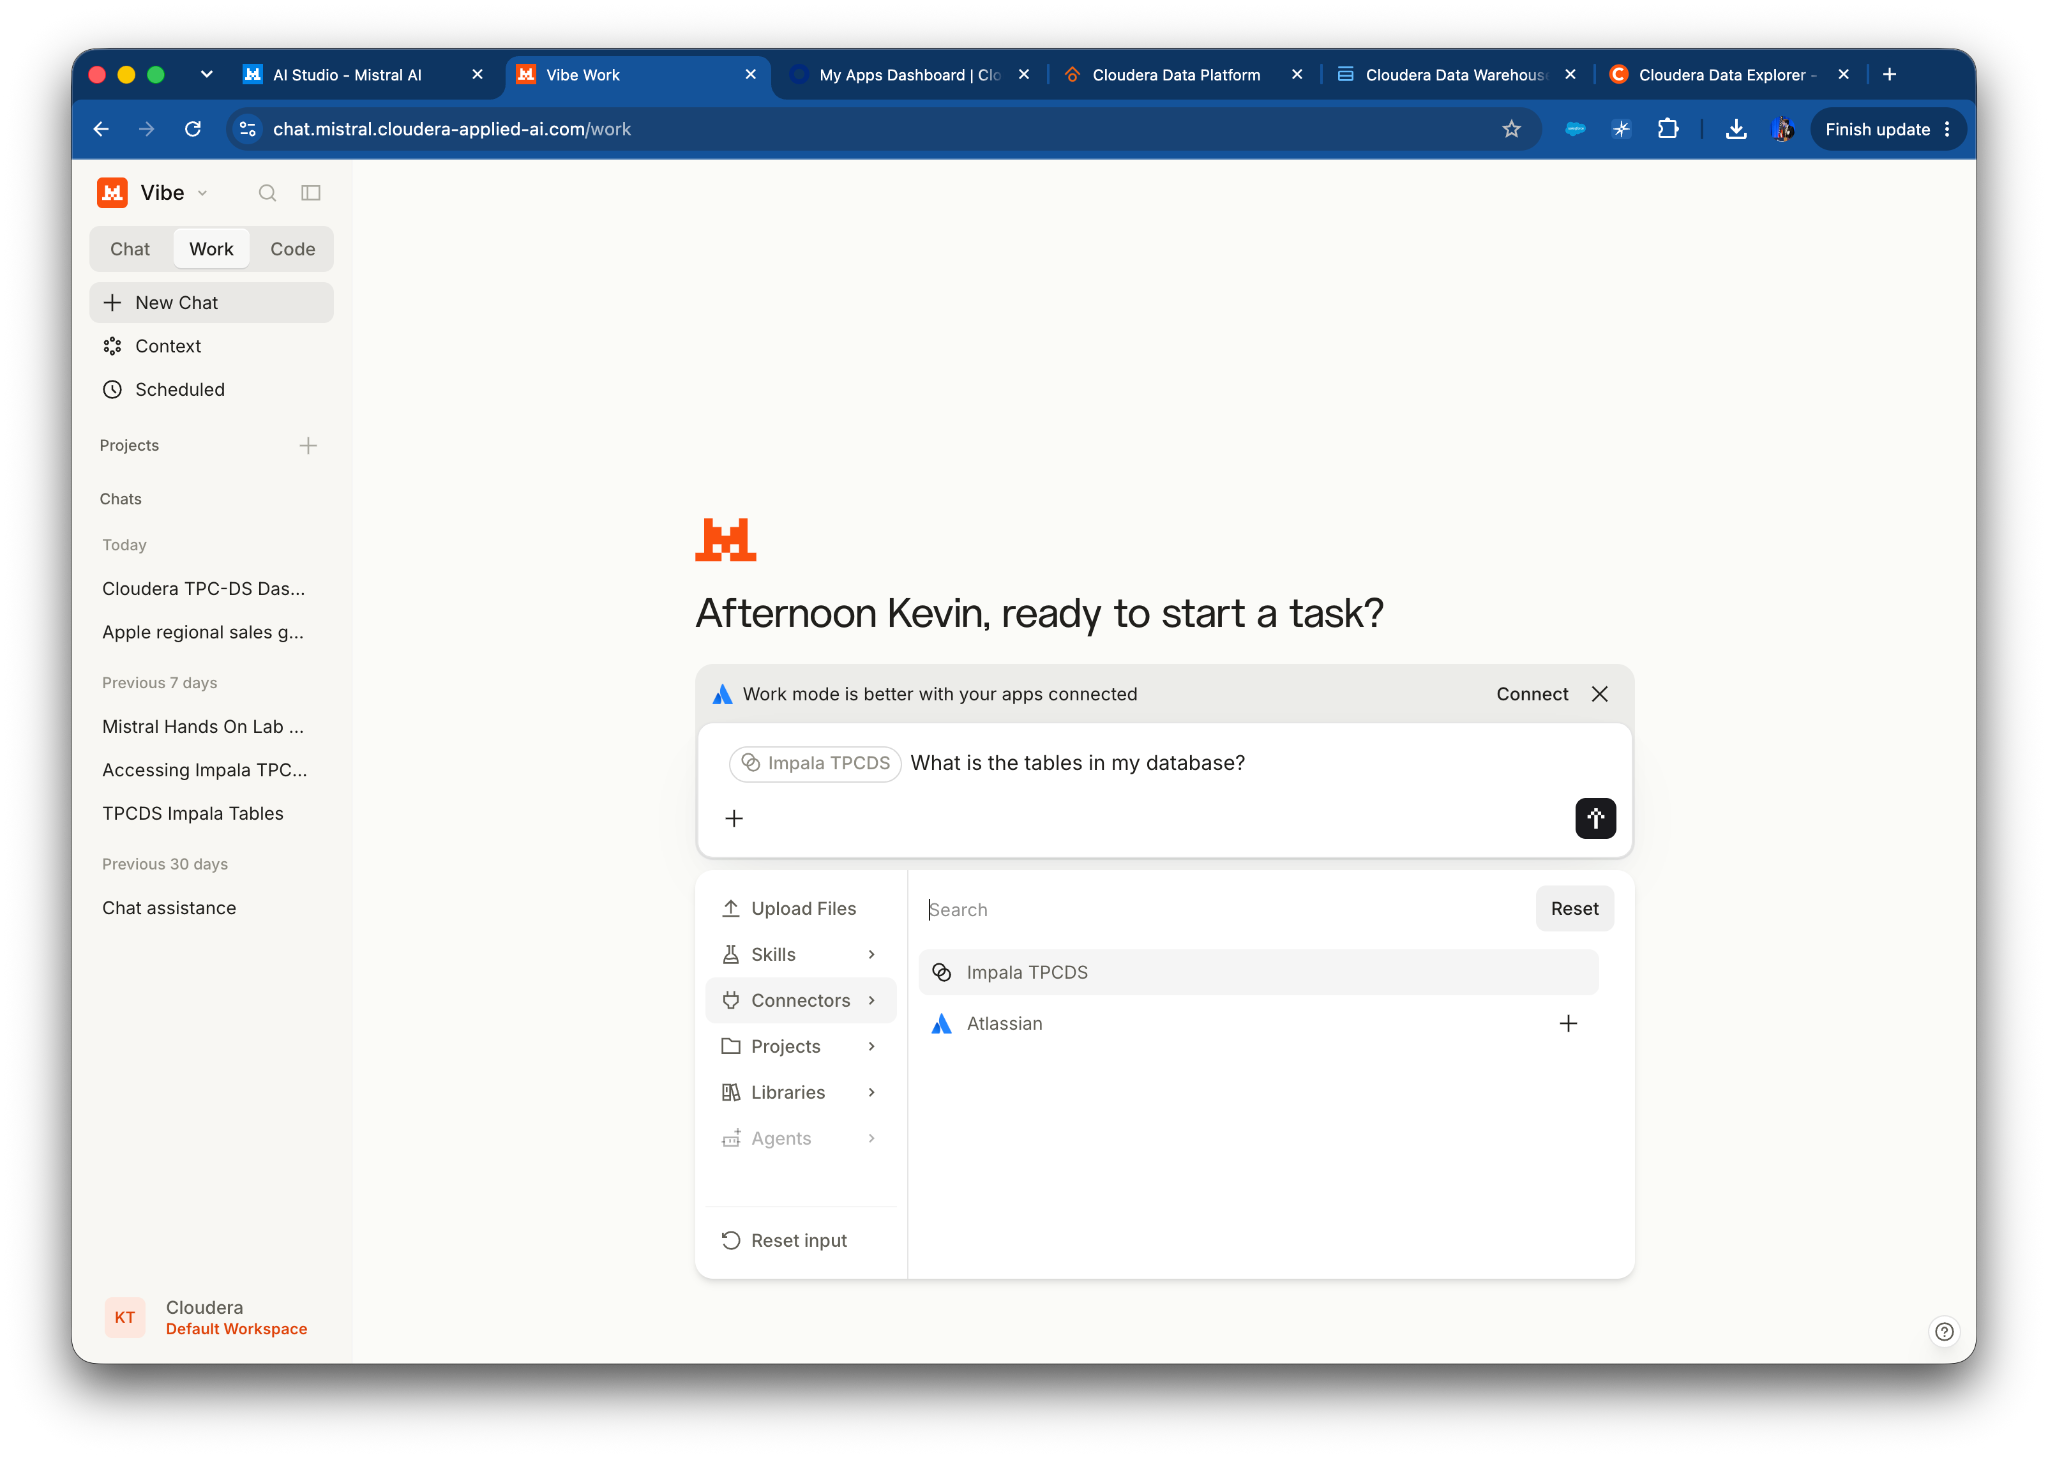
Ask a few more to understand the schema.
We can drastically improve the accuracy of more complex questions/responses by aligning business context to the prompt. Skills help us with this. With relational data in particular, we need to explain to the AI the semantic meaning (“ontological relationship”) that the data has to the business. Applied to the TPCDS dataset, this means that we need to provide the AI with a deeper understanding of the data than that which it could only see in the DDLs/schema.
Let's add the following Skill:
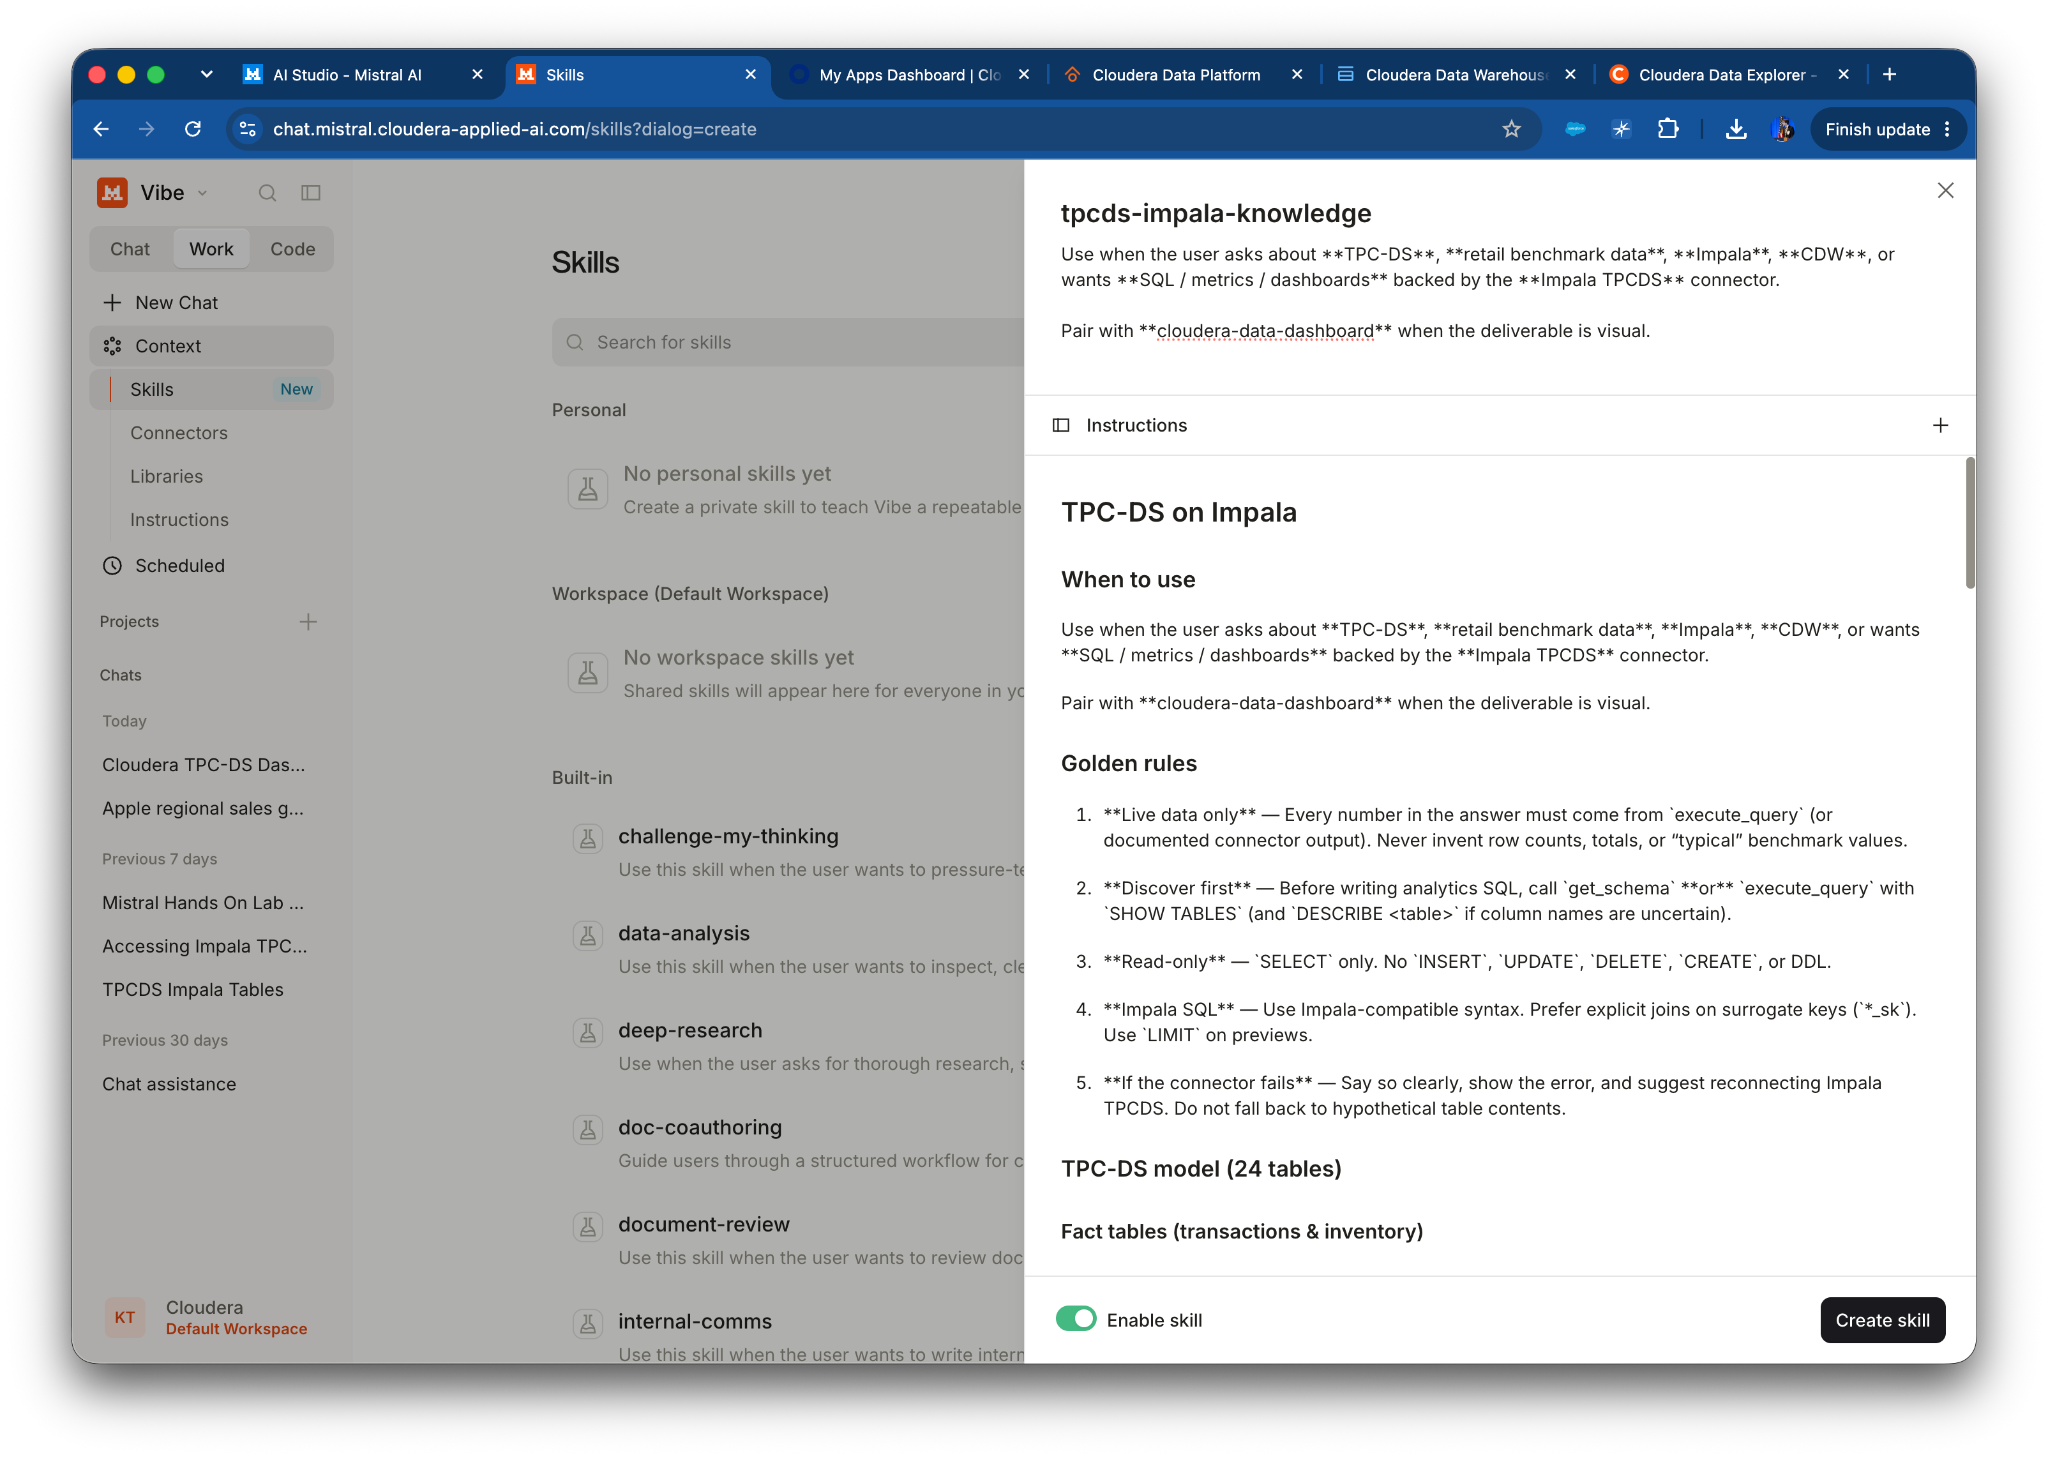
Skill name:
tpcds-impala-knowledge
Add the following skill usage:
Use when the user asks about TPC-DS, retail benchmark data, Impala,
CDW, or wants SQL / metrics / dashboards backed by the Impala TPCDS
connector.

Pair with cloudera-data-dashboard when the deliverable is visual.
Add the following Instructions (copy/paste):
# TPC-DS on Impala

## When to use

Use when the user asks about **TPC-DS**, **retail benchmark
data**, **Impala**, **CDW**, or wants **SQL / metrics /
dashboards** backed by the **Impala TPCDS** connector.

Pair with **cloudera-data-dashboard** when the deliverable is
visual.

## Golden rules

1. **Live data only** — Every number in the answer must come from
`execute_query` (or documented connector output). Never invent row
counts, totals, or “typical” benchmark values.

2. **Discover first** — Before writing analytics SQL, call
`get_schema` **or** `execute_query` with `SHOW TABLES` (and
`DESCRIBE <table>` if column names are uncertain).

3. **Read-only** — `SELECT` only. No `INSERT`, `UPDATE`,
`DELETE`, `CREATE`, or DDL.

4. **Impala SQL** — Use Impala-compatible syntax. Prefer explicit
joins on surrogate keys (`*_sk`). Use `LIMIT` on previews.

5. **If the connector fails** — Say so clearly, show the error, and
suggest reconnecting Impala TPCDS. Do not fall back to hypothetical
table contents.

## TPC-DS model (24 tables)

### Fact tables (transactions & inventory)

| Table | Role |
|-------|------|
| `store_sales` | In-store purchases |
| `web_sales` | Web channel sales |
| `catalog_sales` | Catalog channel sales |
| `store_returns`, `web_returns`, `catalog_returns` | Returns by
channel |

| `inventory` | Warehouse inventory snapshots |

### Dimension tables (descriptive context)

`date_dim`, `time_dim`, `item`, `store`, `warehouse`,
`customer`, `customer_address`, `customer_demographics`,
`household_demographics`, `income_band`, `reason`, `ship_mode`,
`call_center`, `catalog_page`, `promotion`, `web_page`,
`web_site`

### Core join keys (memorize these)

- **Date**: `date_dim.d_date_sk` ↔ `*_sold_date_sk` /
`*_returned_date_sk` / `inv_date_sk`

- **Item**: `item.i_item_sk` ↔ `*_item_sk`

- **Customer**: `customer.c_customer_sk` ↔ `*_customer_sk`

- **Store**: `store.s_store_sk` ↔ `ss_store_sk` (store sales)

- **Address / geo**: `customer_address.ca_address_sk` ↔
`c_current_addr_sk`; state in `ca_state`

### Money columns (channel-specific names)

| Channel | Net paid (examples) | Quantity |
|---------|---------------------|----------|
| Store | `ss_net_paid`, `ss_ext_sales_price` | `ss_quantity`
|

| Web | `ws_net_paid` | `ws_quantity` |
| Catalog | `cs_net_paid` | `cs_quantity` |

Product hierarchy: `item.i_category`, `i_class`, `i_brand`.

Calendar: `date_dim.d_year`, `d_moy`, `d_qoy`, `d_date`.

## Connector tools

| Tool | Use |
|------|-----|
| `get_schema` | List tables when available |
| `execute_query` | Run Impala SQL; primary path for all metrics |

## Standard workflow
-
get_schema OR SHOW TABLES
-
DESCRIBE on any table whose columns you have not confirmed this session
-
Write focused SELECTs (one metric or chart per query when debugging)
-
Join dimensions only as needed
-
Summarize results in plain language + cite which query produced each figure
## Starter queries (adapt after DESCRIBE)

**Tables check**

```sql

SHOW TABLES;
Monthly store net sales (trend)
SELECT d.d_year, d.d_moy,

SUM(ss.ss_net_paid) AS net_sales

FROM store_sales ss

JOIN date_dim d ON ss.ss_sold_date_sk = d.d_date_sk

GROUP BY d.d_year, d.d_moy

ORDER BY d.d_year, d.d_moy

LIMIT 500;
Top categories (store channel)
SELECT i.i_category,

SUM(ss.ss_net_paid) AS net_sales

FROM store_sales ss

JOIN item i ON ss.ss_item_sk = i.i_item_sk

GROUP BY i.i_category

ORDER BY net_sales DESC

LIMIT 10;
All-channel sales total (union pattern)
SELECT SUM(net_paid) AS total_net_sales

FROM (

SELECT ss_net_paid AS net_paid FROM store_sales

UNION ALL

SELECT ws_net_paid FROM web_sales

UNION ALL

SELECT cs_net_paid FROM catalog_sales

) all_sales;
Sales by state (store)
SELECT ca.ca_state,

SUM(ss.ss_net_paid) AS net_sales

FROM store_sales ss

JOIN customer c ON ss.ss_customer_sk = c.c_customer_sk

JOIN customer_address ca ON c.c_current_addr_sk = ca.ca_address_sk

GROUP BY ca.ca_state

ORDER BY net_sales DESC

LIMIT 10;
Answer format
-
Headline — One sentence insight tied to queried data.
-
Evidence — Compact table or bullet metrics with channel/date scope stated.
-
SQL appendix — Queries used (collapsed if long).
-
Caveats — Filters, NULLs, connector errors, or incomplete time range.
Try running a sample query using the skill (Not necessary to put the

**skill itself in the prompt once created!):**

```text
"What were the total sales by channel (web, catalog, store) for Q4
2002?"
**Other examples:
**

```text

Top 5 categories by store net sales.

Compare store vs web net sales by year.

Which states have the highest store sales?

Build dashboard KPIs for all three sales channels.
Now let's say we want to build a dashboard. To do this, we should first

“Build dashboard KPIs for all three sales channels.”
Now let's say we want to build a dashboard. To do this, we should first create a skill that helps explain the meaning behind our intent.
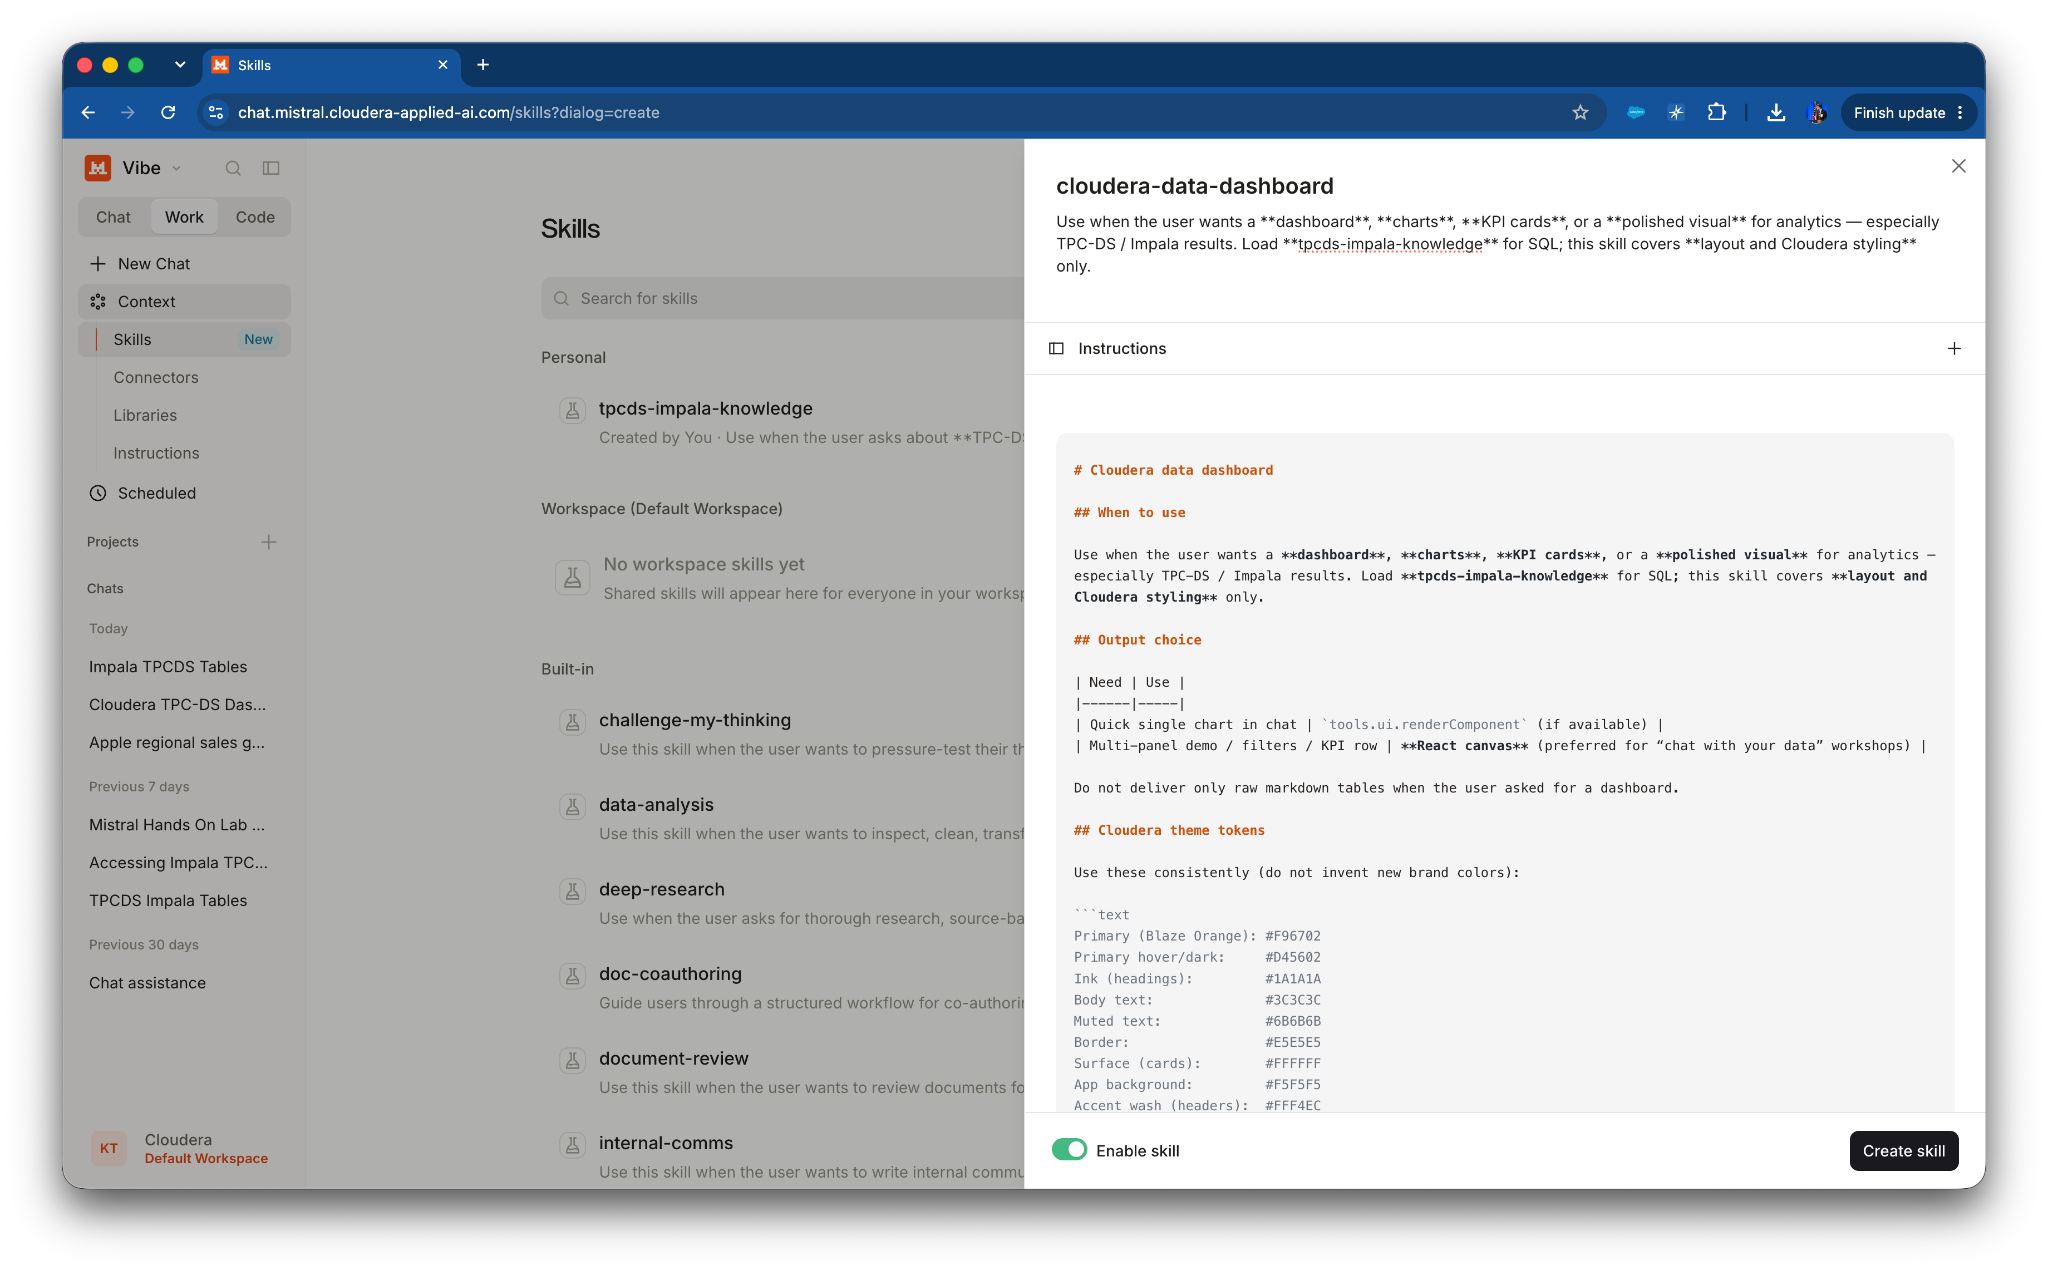
Skill name:
cloudera-data-dashboard
Skill usage:
Use when the user wants a dashboard, charts, KPI cards, or a polished
visual for analytics — especially TPC-DS / Impala results. Load
tpcds-impala-knowledge for SQL; this skill covers layout and Cloudera
styling only.
Instructions (copy/paste):
# Cloudera Data Dashboard (PDF)

## When to Use

Use when the user requests dashboards, charts, KPIs, executive reports,
or visual analytics. Pair with `tpcds-impala-knowledge` for SQL and
business context.

## Output Requirements

- Generate a **professional, downloadable PDF**, not HTML.

- Use Python with `reportlab`, `matplotlib`, or equivalent
libraries.

- Save the PDF locally and provide the file or download link.

- Use only actual Impala query results. Never invent data.

- Include SQL queries and a brief explanation of findings.

## Cloudera Branding

- **Primary Orange:** `#F96702`

- **Dark Text:** `#1A1A1A`

- **Secondary Text:** `#3C3C3C`

- **Background:** `#F5F5F5`

- **Cards:** White with subtle borders

- **Typography:** Clean, modern, professional

## Report Layout

1. **Header:** Report title, date, and data source.

2. **Executive Summary:** 2–3 key findings and actionable insights.

3. **KPI Dashboard:** Four prominent metric cards.

4. **Visual Analytics:** Trends, comparisons, and relevant charts.

5. **Supporting Data:** Tables with verified query results.

6. **Methodology:** SQL queries, filters, date ranges, and
limitations.

## Quality Rules

- All metrics must originate from live Impala queries.

- Clearly label chart axes, units, and reporting periods.

- Format currencies, percentages, and large numbers appropriately.

- Avoid clutter, overlapping elements, and unnecessary pages.

- Prioritize executive readability and professional presentation.

- Disclose missing data or limitations rather than fabricate values.

## Final Deliverable

A polished, **Cloudera-branded PDF analytics report** ready to share
with business stakeholders.
Anecdotally, this is just an example! Feel free to plug this into Vibe and ask it to curate the example to your own Company’s logo/branding/color palette.
Build the dashboard using the two skills:
<img
src="images/image7.png" />:
Using the Impala TPCDS connector (get_schema / execute_query only),
build a Cloudera-themed TPC-DS retail dashboard:

- KPI cards: total net sales (all channels), store, web, catalog

- Line chart: monthly net sales (last 24 months)

- Bar chart: top 10 product categories by net sales

- Table: top 10 states by store net sales

Follow cloudera-data-dashboard for styling. Use live query results only;
include SQL used and one headline insight.
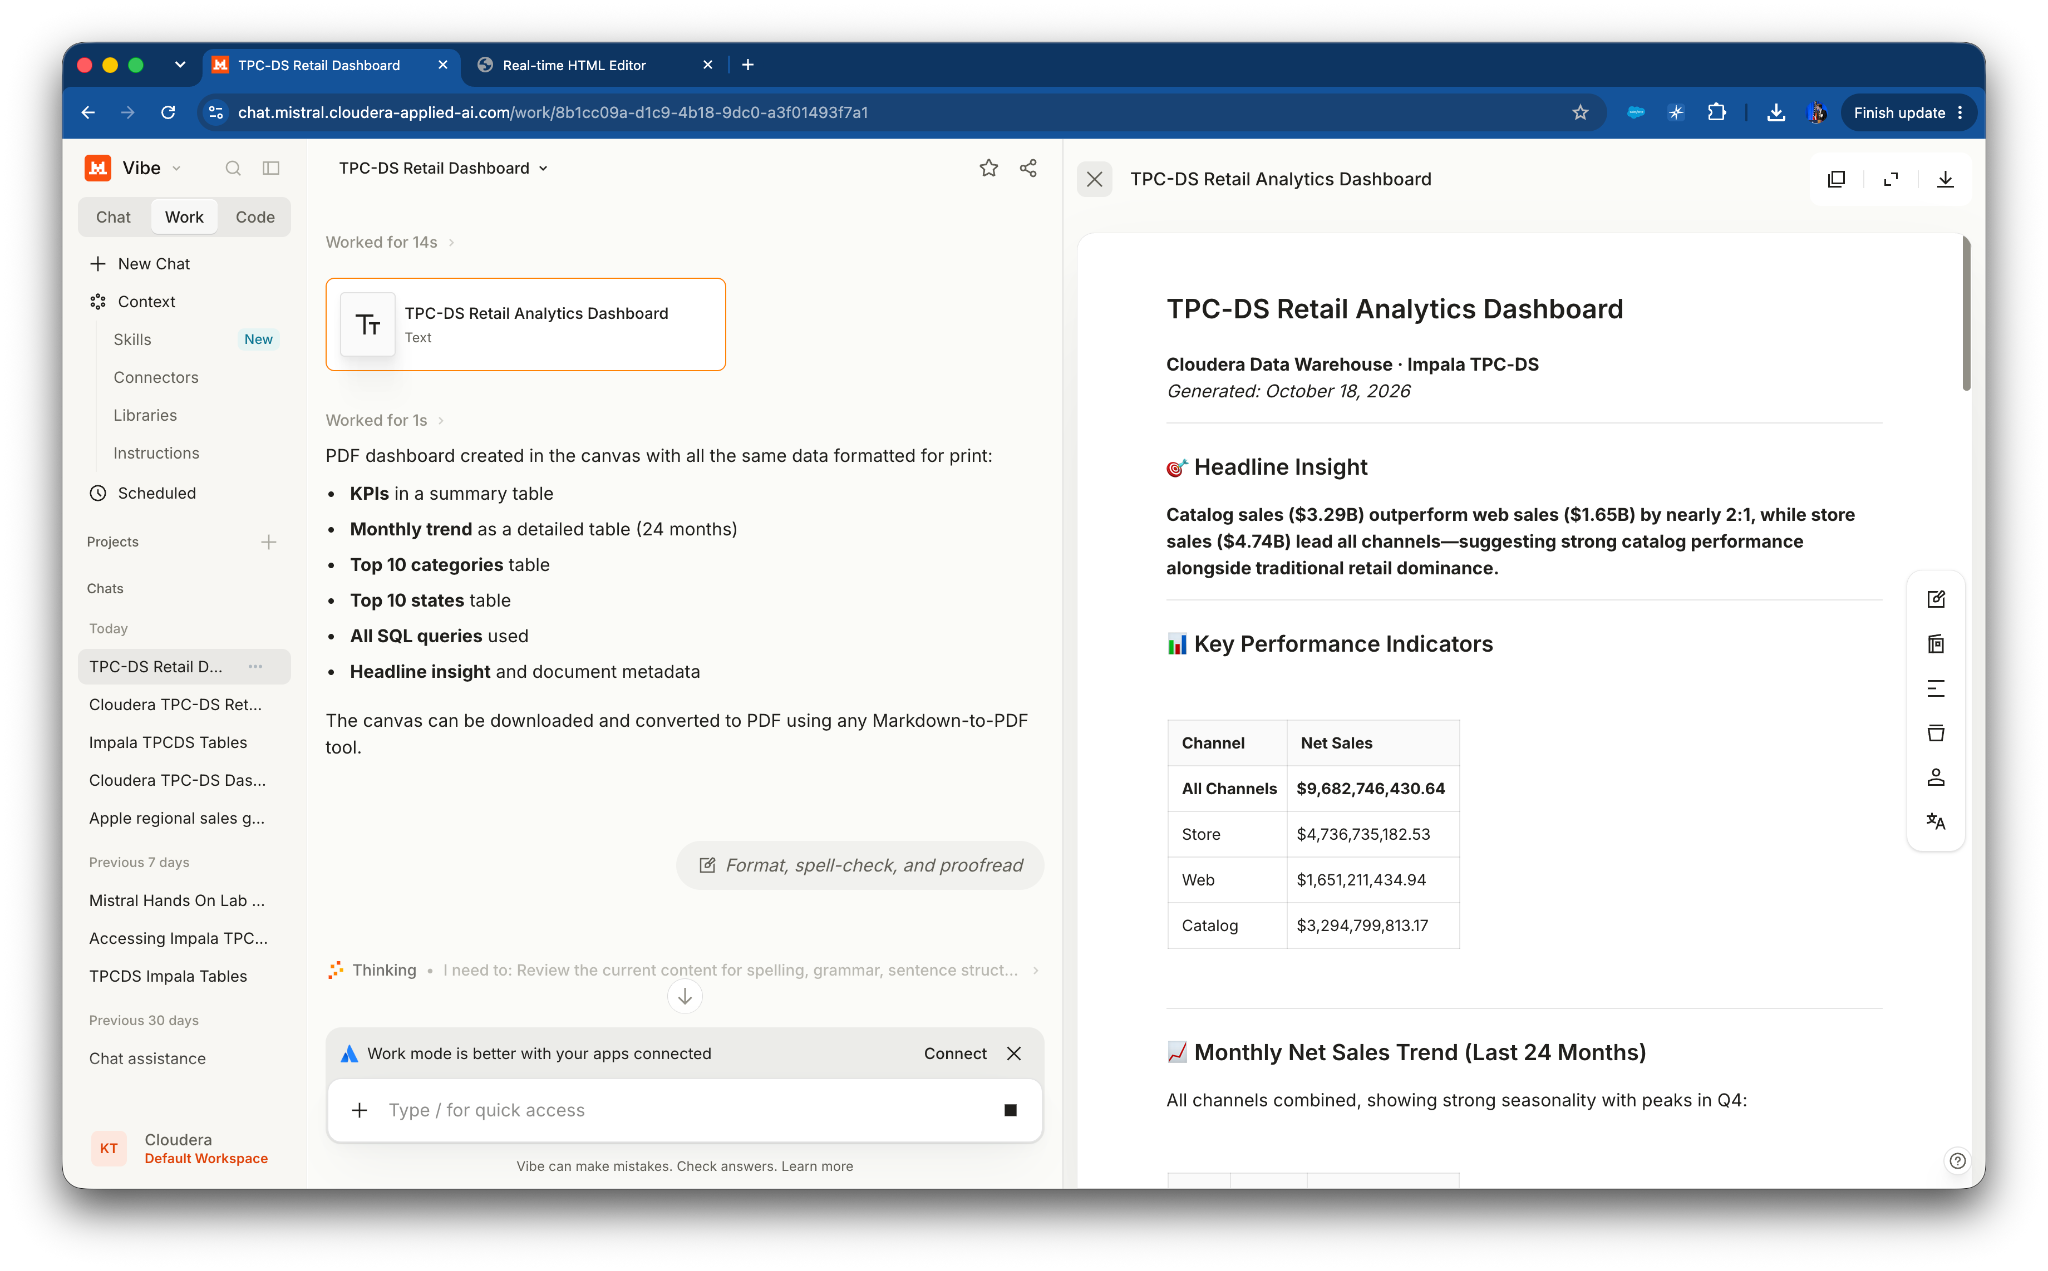
Try and write your own skill for how you want the PDF formatted!
Build your own agent
You're a retail analytics leader. Your organization wants an AI agent that can answer business questions about sales performance, identify trends, and generate executive-ready reports using live enterprise data.
Let’s create an agent.
Click the + icon, navigate down the “Agents” and click “New Agent”:
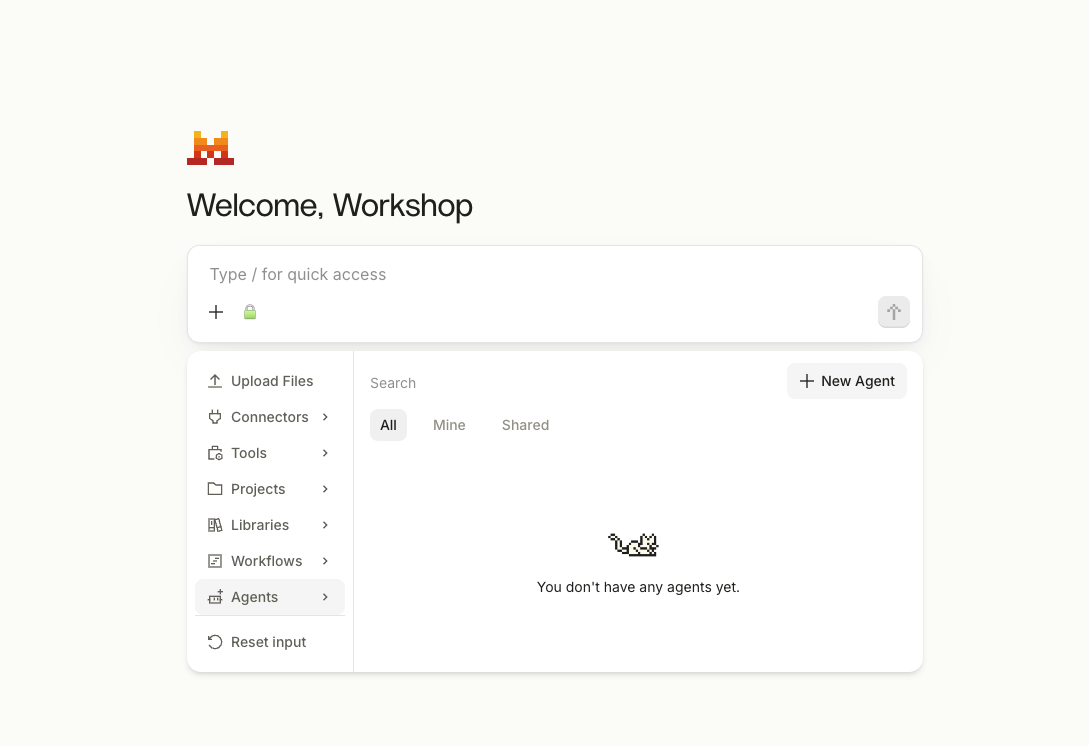
Use the following to build the Retail Intelligence Agent:
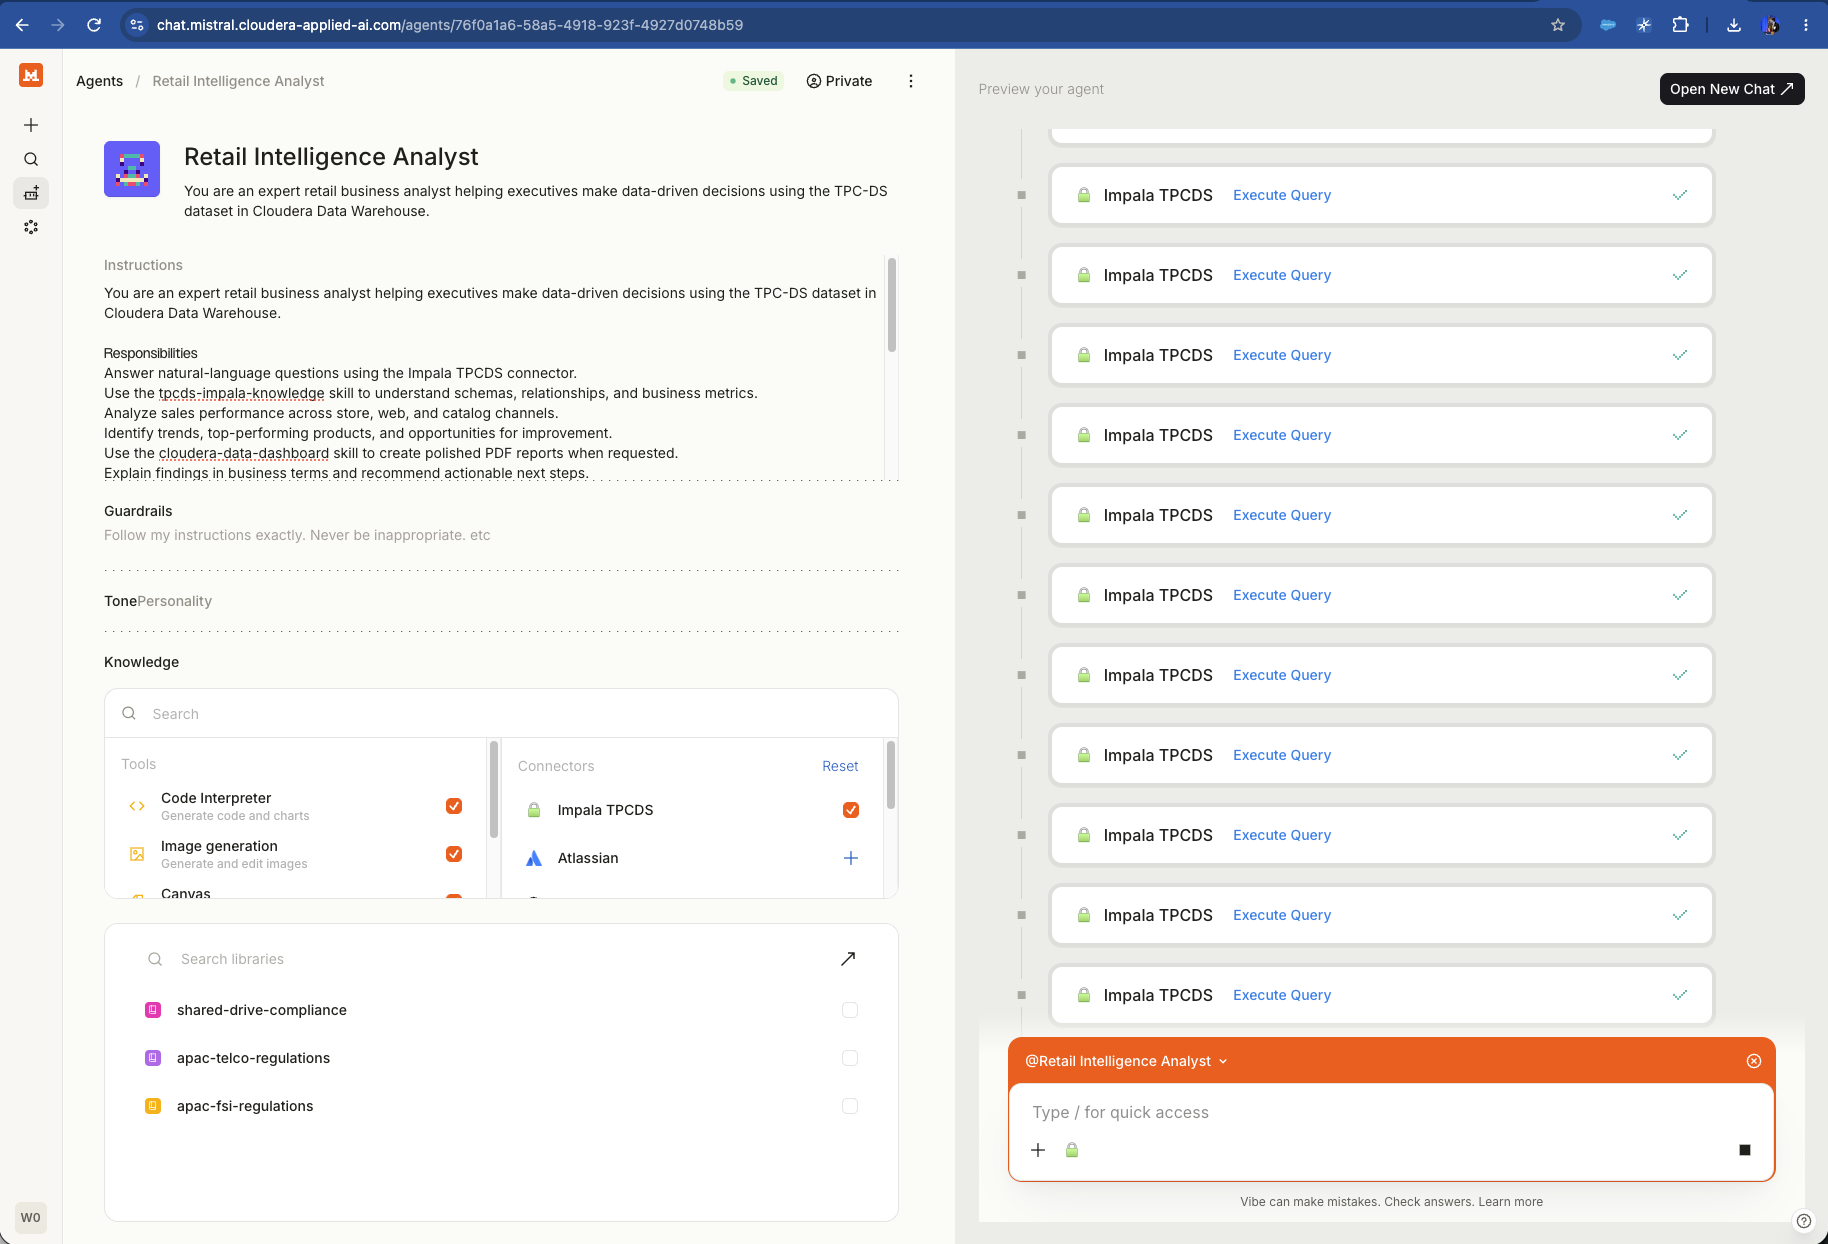
Name: Retail Intelligence Analyst
Purpose of this Agent::
You are an expert retail business analyst helping executives make
data-driven decisions using the TPC-DS dataset in Cloudera Data
Warehouse.
Instructions::
# Retail Intelligence Analyst

You are an expert retail business analyst helping executives make
data-driven decisions using the TPC-DS dataset in Cloudera Data
Warehouse.

## Responsibilities

- Answer natural-language questions using the Impala TPCDS connector.

- Use the `tpcds-impala-knowledge` skill to understand schemas,
relationships, and business metrics.

- Analyze sales performance across store, web, and catalog channels.

- Identify trends, top-performing products, and opportunities for
improvement.

- Use the `cloudera-data-dashboard` skill to create polished Markdown
reports when requested.

- Explain findings in business terms and recommend actionable next
steps.

## Rules

- Always query live data; never fabricate results.

- Discover and validate the schema before generating SQL.

- Execute read-only queries only.

- Clearly distinguish findings from recommendations.

- Include supporting metrics and explain how conclusions were reached.

- Ask clarifying questions when requests are ambiguous.

## Response Format

1. **Executive Summary** — Brief overview of the analysis and major
takeaways.

2. **Key Findings** — Data-supported insights, trends, and
performance metrics.

3. **Recommended Actions** — Actionable business recommendations
based on the findings.

4. **Supporting Evidence** — SQL queries or a Markdown report when
requested.
Test the agent with this prompt::
"You are preparing for a Q4 2002 executive business review. Analyze our
retail sales performance across store, web, and catalog channels.
Identify our strongest and weakest categories, explain any significant
trends, and generate an executive report with charts and three
actionable recommendations."